
Page 45
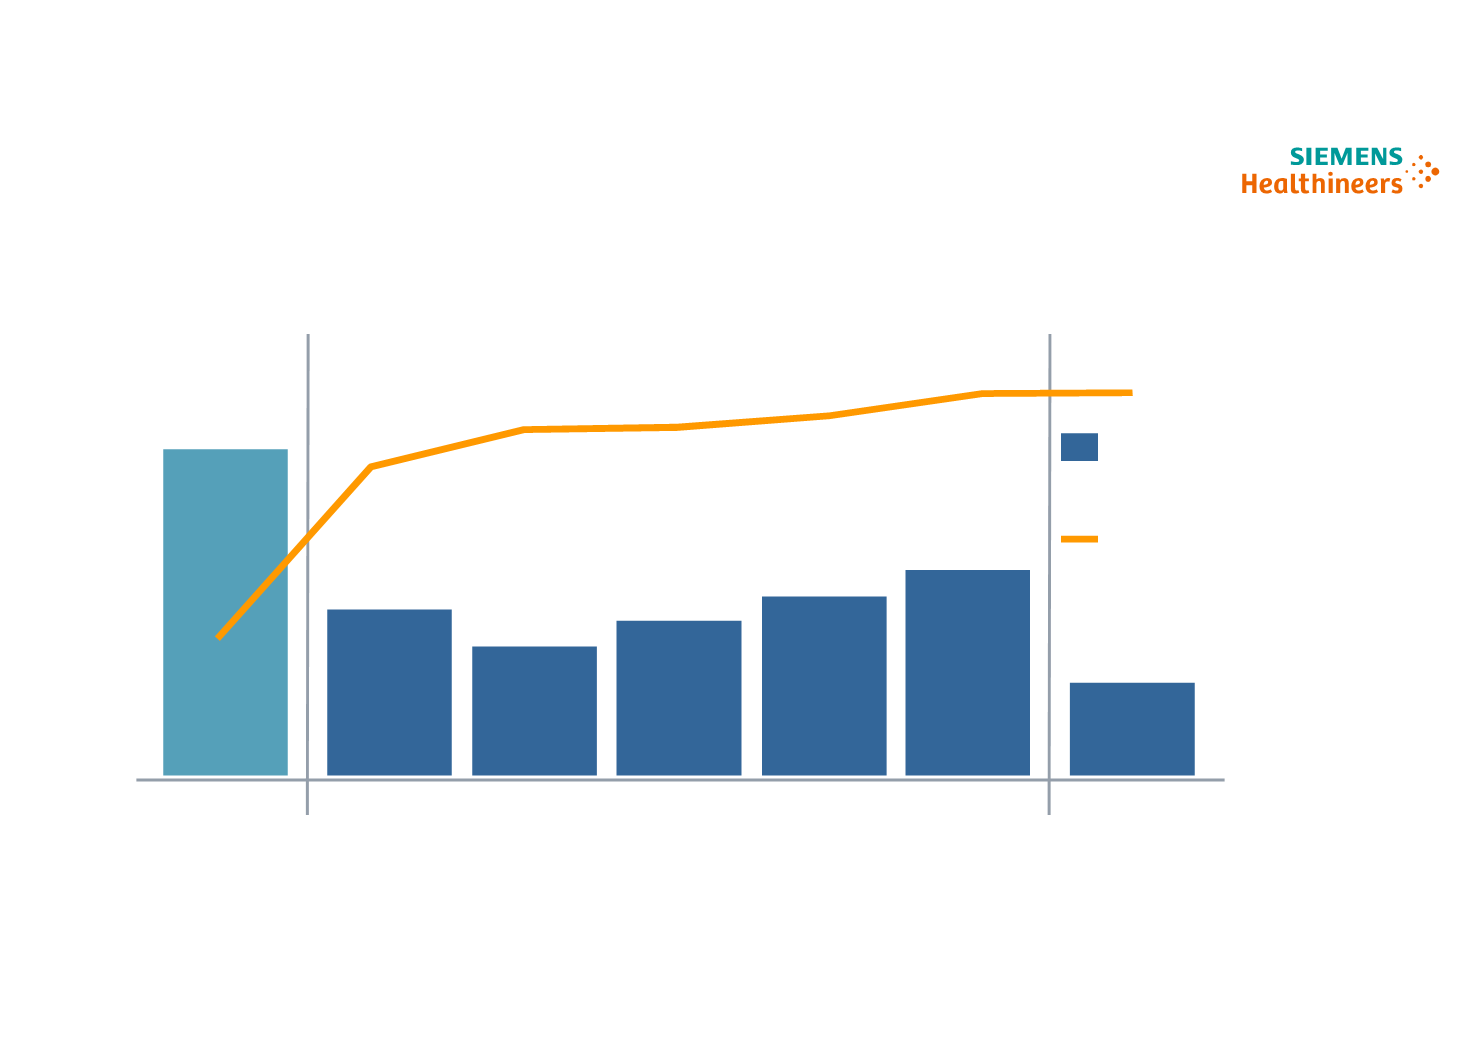
Usuarios de Automatización observan resultados
tangibles
Data cortesía de Hospital University de Michigan
2010
2011
2012
2013
2014
2015
2016
26
13
10
12
14
16
7
Promedio mensual Errores
356 K
600 K
651 K 655 K 670 K 688 K 701 K
Promedio mensual
Vol de Tests


